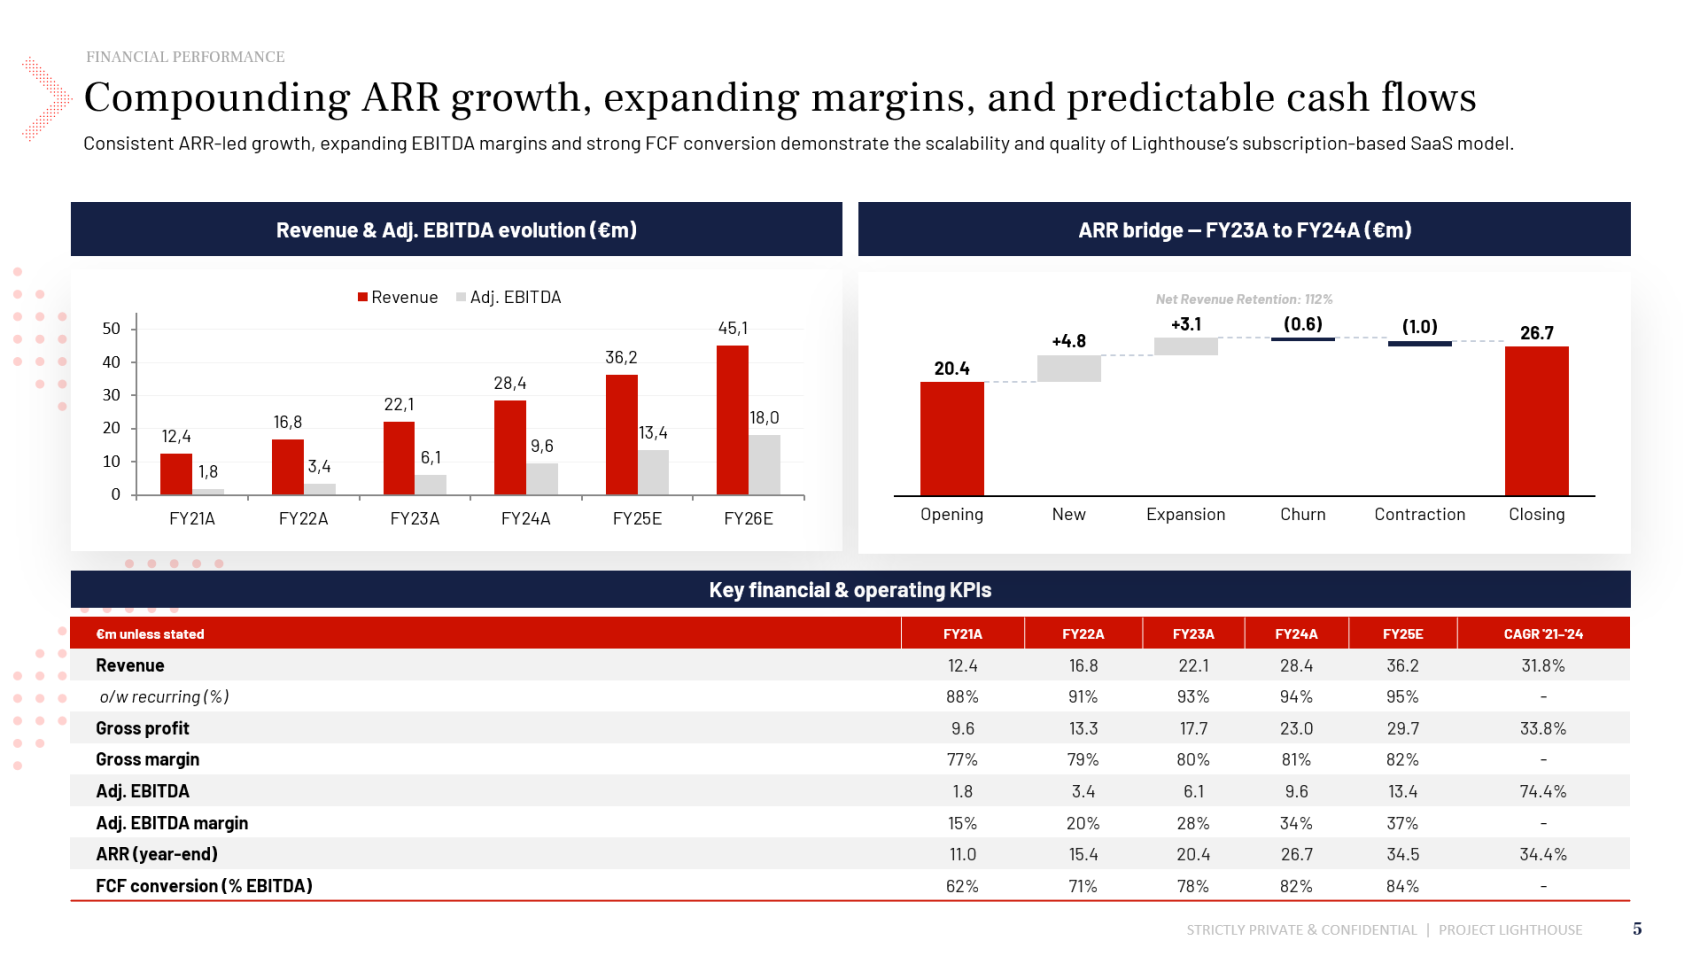

Financial performance with ARR bridge
Financial slide featuring three elements: a bar chart showing revenue and EBITDA growth, a waterfall chart as an ARR bridge (Opening, New, Expansion, Churn, Contraction, Closing), and a KPI table with Gross Margin, ARR, and FCF Conversion over five fiscal years. Demonstrates how to present recurring revenue and profitability on a single, investor-ready slide.
Category
Investment Banking
Use case
Information Memorandum / Teaser
Type
Financial Overview