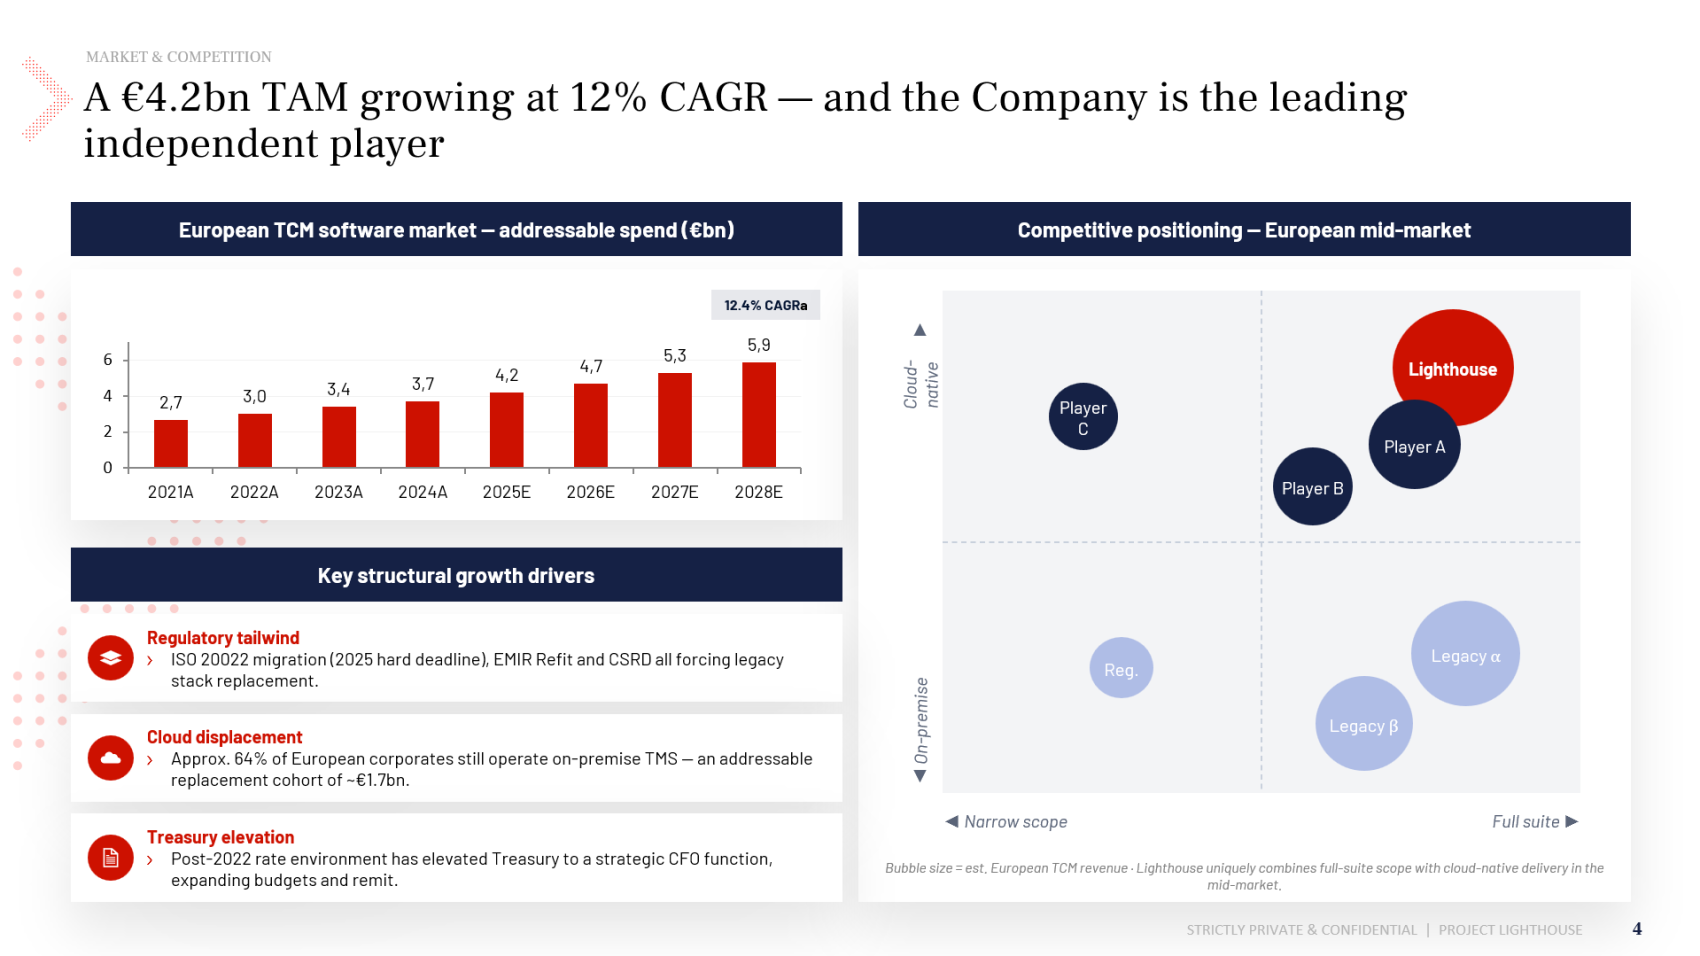

Market size and competitive positioning
Market slide with two visualizations: a bar chart showing TAM growth with a CAGR callout, and a bubble chart for competitive positioning across Cloud-native vs. On-premise and Narrow Scope vs. Full Suite axes. Supported by three structural growth drivers—the standard format for proving market attractiveness in an M&A document.
Category
Investment Banking
Use case
Information Memorandum / Teaser
Type
Market Overview