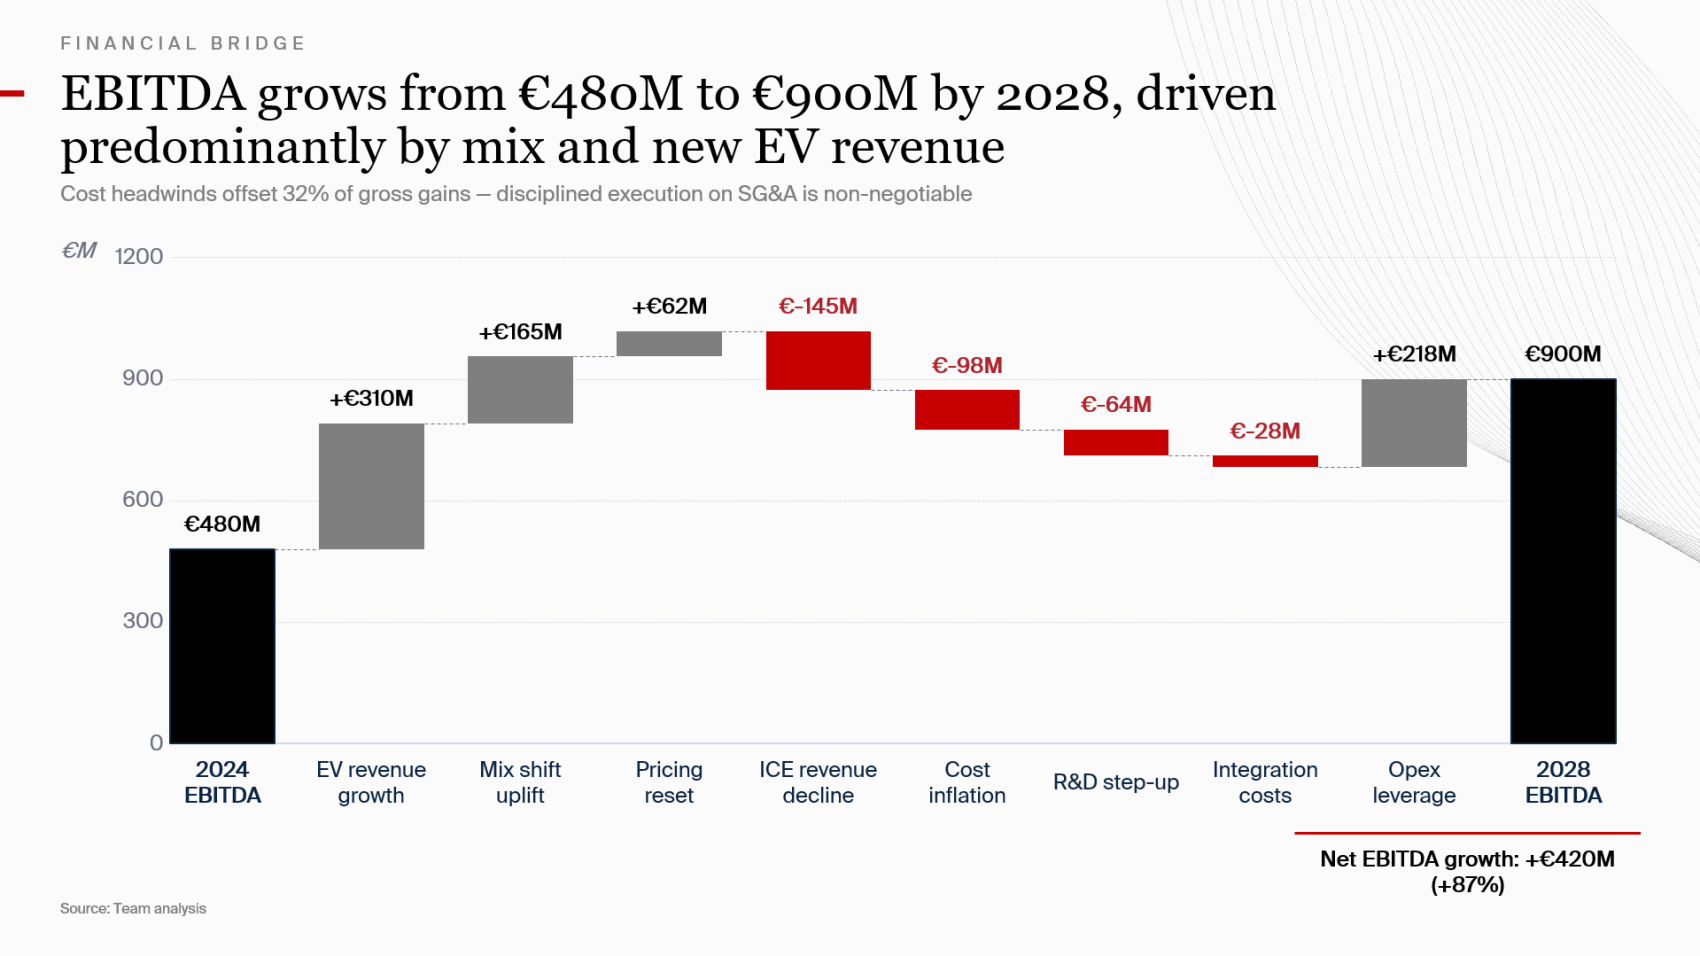

Five-year EBITDA bridge
Waterfall slide breaking down EBITDA growth from actuals to target into drivers (revenue growth, mix shift, pricing) and headwinds (legacy decline, cost inflation, integration costs), with a net effect summary. This bridge chart answers the board’s primary question: where specifically does the result come from?
Category
Strategy Consulting
Use case
Business Case / Strategy Evaluation
Type
Financial Bridge